

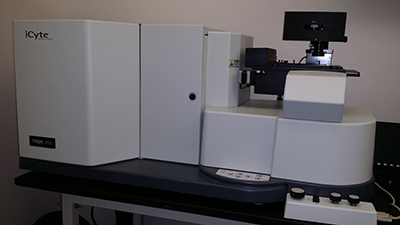
The iCyte is a laser scanning (automated and quantitative imaging) cytometer which combines digital microscopy with image processing and the real time population data analysis of analytical cytometry. It is a non-confocal system that utilizes laser-spot scanning illumination. The detection system, which combines PMTs for fluorescence detection and photodiodes (PD) for absorbance and scatter detection, offers excellent quantitative cytometric performance and imaging capabilities. The instrument's unique design allows simultaneous use of fluorescent and chromatic dyes.
The instrument has the following features:
- 4 visible excitation lines: 405nm, 488nm, 561nm, 633nm.
- 4 PMTs and 2 PDs
- The microscope unit is an Olympus IX-71 microscope with a motorized stage, autofocus motor, brightfield lamp, and a forward scatter detector.
- The iCys Cytometric Analysis software.
- The optional iNovator Toolkit and iBrowser Data Integration Software for complex data analysis and display.
Links:
Technical data on icyte: http://www.thorlabs.com/newgrouppage9.cfm?objectgroup_id=7473
iCyte Quick reference guide: http://www.nature.com/nmeth/journal/v7/n4/full/nmeth.f.302.html
iCyte overview video: https://www.youtube.com/watch?v=tpg9k3gLWQw
Manufacturer: Thor Labs
Equipment Model: TLC 1413
Location: 121H, Carl R. Woese Institute for Genomic Biology
Contact Person: Kingsley Boateng, PhD(https://www.igb.illinois.edu/corefacilities/contact),
217-333-1642 kboateng@igb.illinois.edu
Fees & Consumables: See fees page.
Sample Images:
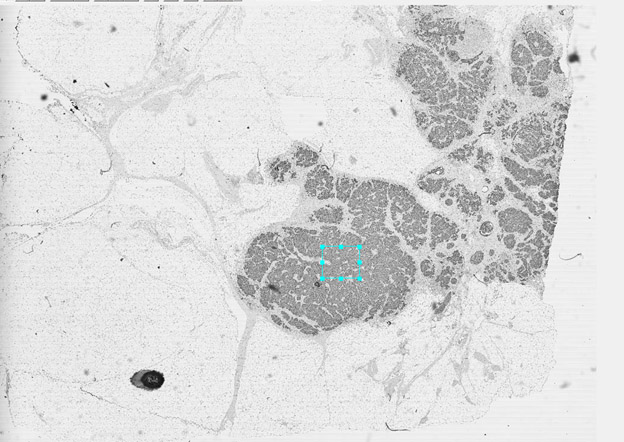
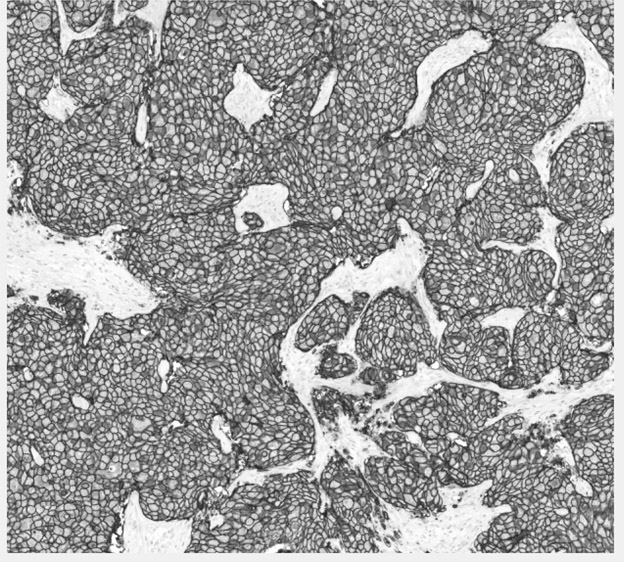
High Resolution Tissue Scanning and Analysis
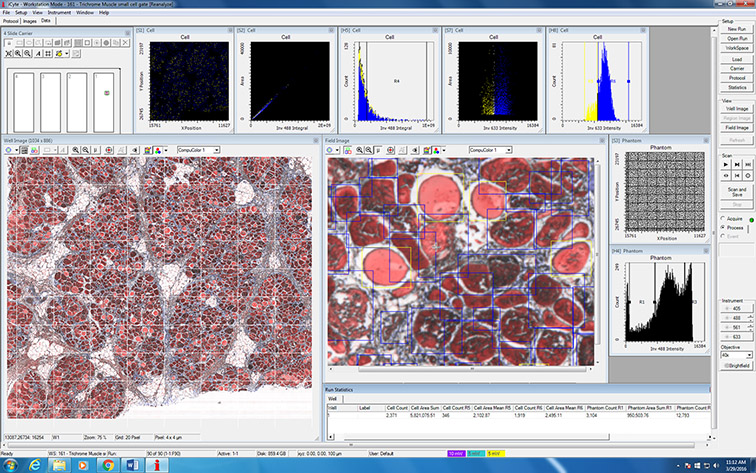
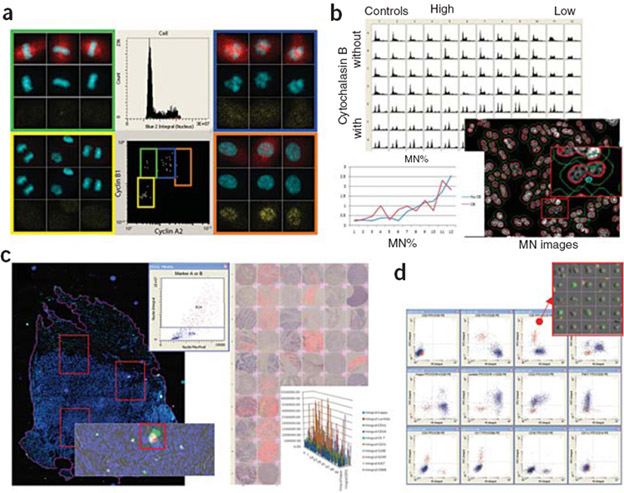
Example applications of LSC technology
(a) Advanced cell cycle analysis: HuVEC cells stained with DAPI and antibodies for cyclin B1, cyclin A2 and pH3. Phases of mitosis are determined from levels of cyclin B2 and cyclin A1. Gating is confirmed by image galleries. (b) Micronucleus (MN) assay: quantitative and image data showing cell cycle effects of etoposide on CHO cells. (c) Automated fluorescently labeled tissue section (left) and TMA (right) analysis. An initial rapid overview scan identifies areas for high-resolution scanning. Quantitative data on marker expression is generated automatically from high-resolution scans. (d) Cell surface immunophenotyping. Scattergram panel shows cells single and double positive for cell surface markers. Inset, gallery of representative cells for one subpopulation. (Melvin Henriksen, Nature Methods 2010)