New model accurately describes COVID-19 waves and plateaus
Share
The COVID-19 pandemic has gone on much longer than many predicted in its earliest months. The world has closely watched its progression, with infection rates measured out on graphs in large waves that sometimes taper to extended plateaus, rather than disappearing as traditional epidemiological models would have suggested they should. Meanwhile, scientists have been working to better understand the factors governing the wave and plateau dynamics of the spread of COVID-19, to be able to better forecast future outbreaks in this pandemic and future epidemics. The earliest epidemiological models developed a century ago represented the spread of disease in very simple terms, not accounting for any variability in a population, whether physiological or social. Over the last two decades, epidemiology has incorporated these kinds of variables, while still assuming that each variable remained constant in time.
Now a team of scientists has developed an epidemiological model that encompasses the randomness and dynamic variability of individual social interactions, as well as individual differences in the size of social networks. The team reports that this newly accounted-for random dynamic factor will always produce waves or plateaus of infections—like those seen throughout the pandemic—whether or not the model also accounts for individuals’ changing their social behavior based on knowledge of current infection rates. The new model, which builds on the team’s earlier findings published in April of this year in the Proceedings of the National Academy of Sciences is validated against empirical data taken from four U.S. regions prior to the introduction of COVID-19 vaccines. The model further tells us that COVID-19 may be here to stay—it shows a clear path for it to become endemic in the global population, much like the common cold or the flu.
These results are published online in the November 8, 2021 issue of the journal eLife.
It’s well understood that COVID-19 infection is a function of in-person social interactions—the frequency of face-to-face interaction—or even just time spent in a room with other people—is the variable that determines both an individual’s likelihood of catching COVID-19 and their ability to infect others with the virus. But the complexity of social networks and each person’s inconsistent levels of social activity over time make it difficult to integrate this factor into predictive epidemiological models. At the same time, the availability of modern-day proximity data from devices like RFID, Bluetooth, and Wi-Fi, in addition to the possibility of social network tracking through digital communications, can provide new insight into how social networks and activities drive the spread of COVID-19 infections.
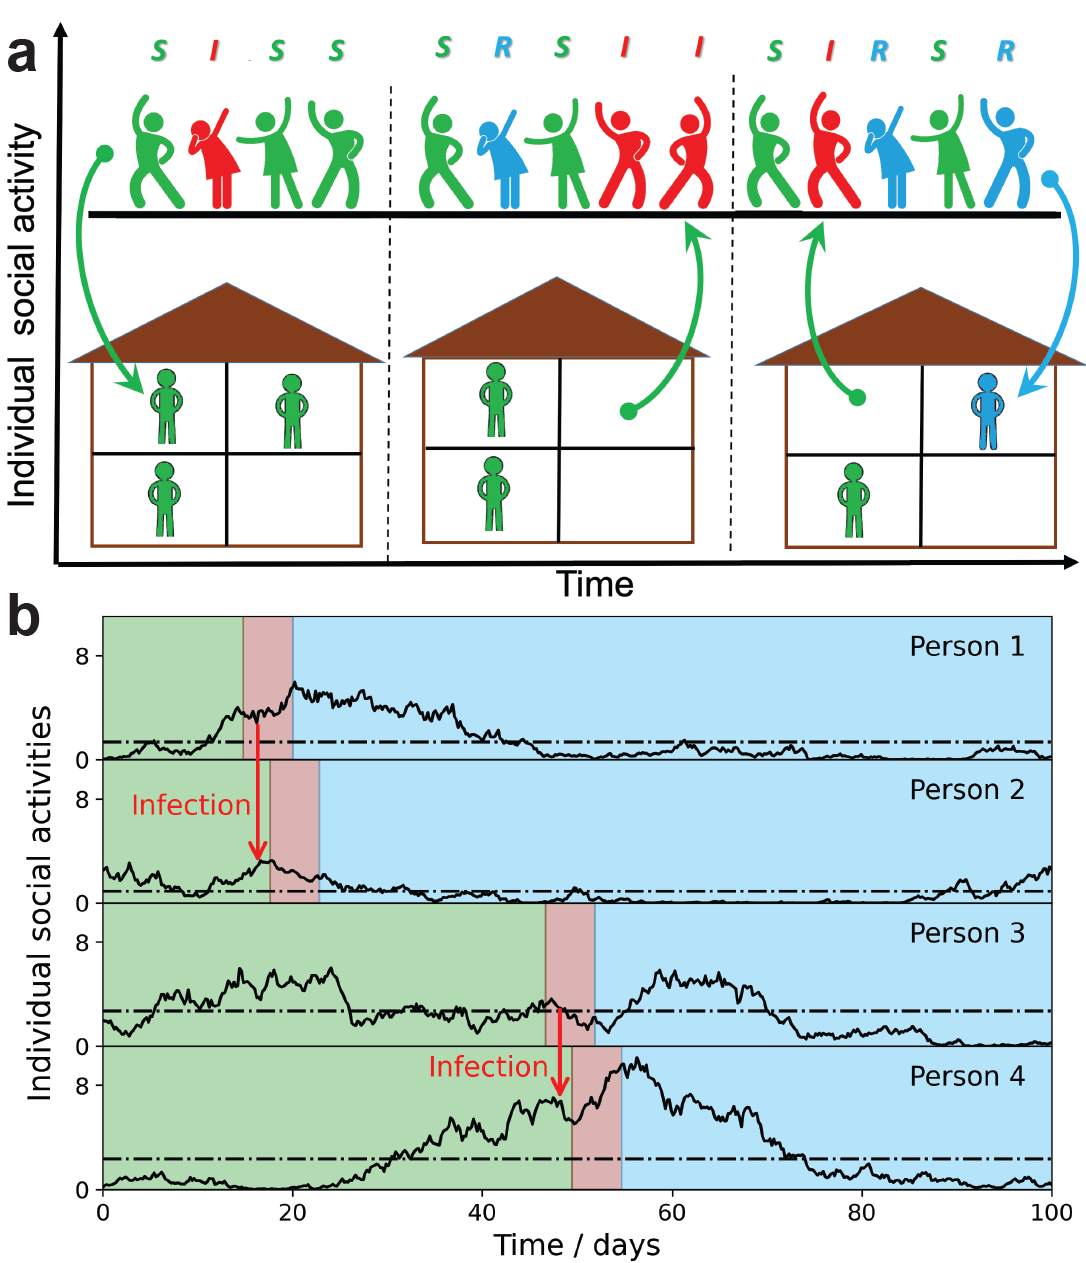
In the current work, scientists at the U.S. Department of Energy's (DOE) Brookhaven National Laboratory, the University of California San Diego (UCSD), and the University of Illinois Urbana-Champaign (UIUC) developed a stochastic social activity (SSA) model, which they paired to a traditional epidemiological model. Stochastic here refers to individual social activity being random and unpredictable, a variable that can nevertheless be captured in mathematical equations through probability distributions that are averaged out over time. The SSA is inspired by real-world observations based on proximity data, like the fact that any given individual’s social activity tends to happen in bursts over short time scales, with longer in-between periods reverting to average sustained social-activity levels.
The new SSA model builds on the researchers’ prior published work that showed the concept of “herd immunity” does not apply to the COVID-19 pandemic, because this type of collective immunity to the disease turns out to be short-lived. Instead, what emerges is a fragile and temporary state of collective immunity, which they coined "transient collective immunity" (TCI). This earlier work captured individual heterogeneity of both biological and individual social-activity levels in one parameter they called the “immunity factor.”
Lead author Alexei Tkachenko, a physicist in the Theory and Computation Group at the Center for Functional Nanomaterials (CFN), a DOE Office of Science User Facility at Brookhaven Lab, says the current work resolves some longstanding problems in epidemiological modelling.
“Our new model describes three phenomena: why during a pandemic, a wave stops; how it can progress at a nearly constant rate, forming a plateau; and why new pathogens actually stay with us permanently, entering what’s called an endemic state,” he notes. “This is an old mystery in epidemiology. Classical theory tells us when a new pathogen is introduced, it will eventually kill itself off by infecting enough people that herd immunity is developed, unless biological immunity is very short-lived. But even in the case where long-term biological immunity is developed, we explain the scenario of how a new pathogen stays endemic in a population.”
Sergei Maslov (BCXT), a UIUC professor of bioengineering and physics and Bliss Faculty Scholar, says the team’s work shows the endemic state is virtually guaranteed for COVID-19. “I will be very surprised if it doesn’t stay with us for the future,” asserts Maslov.
Maslov, who also is a CFN user at Brookhaven Lab, says the new study completes the story the team introduced in April.
“This current study continues the social-network tradition of our prior work and fleshes out an idea we introduced at the end of that paper. Social activity levels are not just different for different people, but different for each person as a function of time. In this paper, we account not only for differences between people in the size of their social networks, but also individual changes in social activity over different timescales. We found a simple way to formulate it so we can easily capture these dynamics in terms of a single number. And this number basically tells you how much heterogeneity of social activity contributes to reduction of the epidemic, or how soon a peak will be reached.”
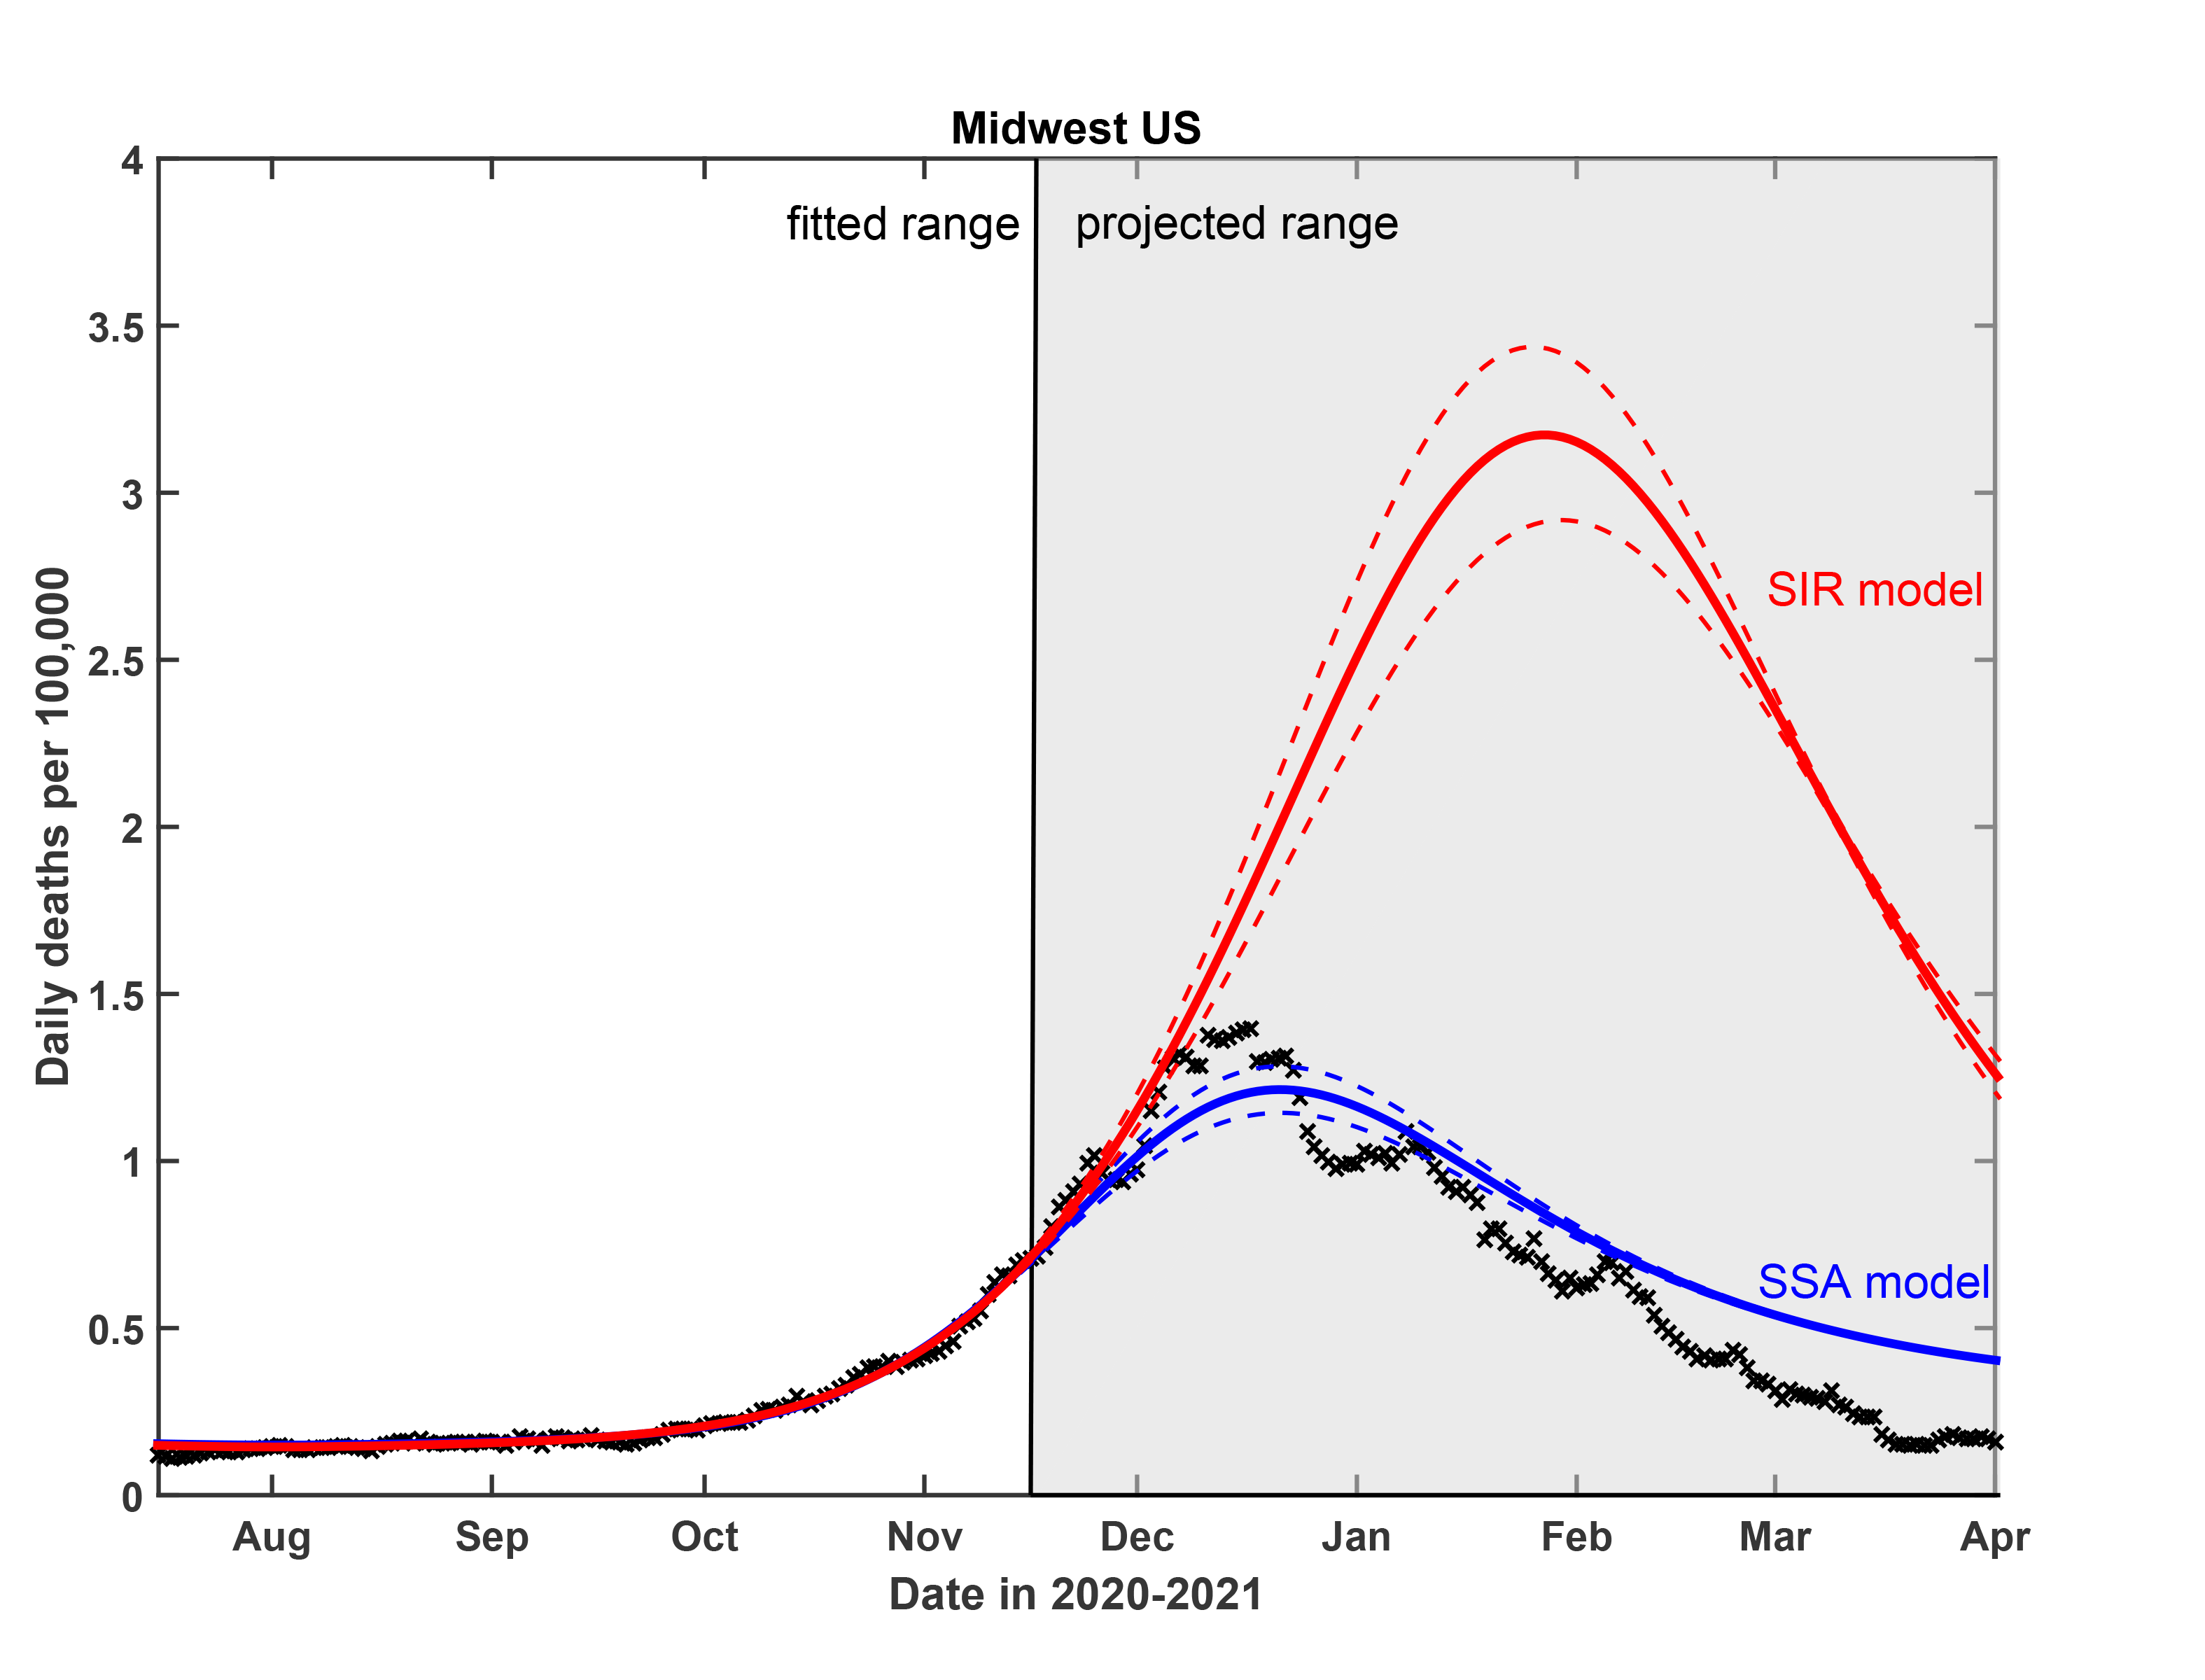
In the SSA model, the scientists represent the complexity of the population’s heterogenous social dynamics in a simple mathematical description, encapsulating the real-world observation that the highest infection rates occur during the highest activity levels. Adding SSA to traditional epidemiological modeling techniques, the team’s model mirrored the real-life progression of COVID-19 in the four U.S. regions they compared it to, providing accurate progressions of infection-rate waves and plateaus over time. Tkachenko and Maslov performed the pen-and-paper calculations for the new model. Agent-based computer simulations applying those equations were developed by recent Illinois Physics Ph.D. graduate Tong Wang, now a postdoctoral researcher at Harvard Medical School.
Illinois Physics Emeritus Research Professor Nigel Goldenfeld, now the Chancellor’s Distinguished Professor of Physics at University of California San Diego, notes, "One of the interesting things about this work was that we realized, the simplest model we could write down for stochastic social activity included the fact that people's behavior eventually reverted to their particular average activity. Mathematically this looked exactly like the equations describing the behavior of financial interest rates, so we were able to use our experience with financial mathematics in this epidemiological context. Another cool example of cross-disciplinary science!"
Tkachenko sums up, “Our work is addressing this social component—a full-scale model would also take into account the effects of vaccines, lockdowns, and new variants. It’s well known that there are three major factors that can trigger a wave. One is the introduction of a new variant of the virus, another is a seasonal change in social activity, and third is the lifting of mitigation efforts such as lockdowns. These are three well-recognized mechanisms accounting for how a wave starts. In our work we find a somewhat smaller effect that says, even if you don’t do anything, there may be a second wave of infection based on differences in individual levels of social activity.”
Maslov adds, “What we are providing here is yet another factor that contributes to the dynamics of a pandemic that consists of multiple waves. In our case, our waves are caused exclusively by changes in the time-averaged level of social activity of individuals. Everybody is fluctuating around this average level of activity. In this case, the fluctuations in activity level lead to a significant change in the propagation of the epidemic in waves and plateaus.”
Prior to publication, the current work was reviewed by Harvard University Epidemiology Professor Mark Lipsitch, founder of Harvard’s Center for Communicable Disease Dynamics (CCDD) and director of science at the U.S. Center for Disease Control and Prevention (CDC)’s new Center for Forecasting and Outbreak Analytics.
Lipsitch published this comment about the current work, “This is an excellent and elegant example of what theory can do at its best in epidemiology: it takes a widely observed phenomenon that is an ‘embarrassment’ (my word) to current theories; proposes a parsimonious explanation that is plausible for the phenomenon by extending the existing theories in a specific way; and makes a plausible case for the importance of the mechanism in explaining key features of the data. In this case, the embarrassing phenomenon is long periods of very slowly changing incidence/prevalence, and the modification to theory is incorporation of dynamic social heterogeneity. This should stimulate much further work in the field. Congratulations to the authors.”
This research is funded by the DOE Office of Science, University of Illinois System Office, the Office of the Vice-Chancellor for Research and Innovation, the Grainger College of Engineering, and the Department of Physics at the University of Illinois Urbana-Champaign. Brookhaven National Laboratory is supported by the U.S. Department of Energy’s Office of Science. The Office of Science is the single largest supporter of basic research in the physical sciences in the United States and is working to address some of the most pressing challenges of our time. For more information, visit https://energy.gov/science. The conclusions presented are those of the researchers and not necessarily those of the funding agencies.