Here are some examples of the Minflux data collected in the first two weeks after installation:
Gruebele Lab
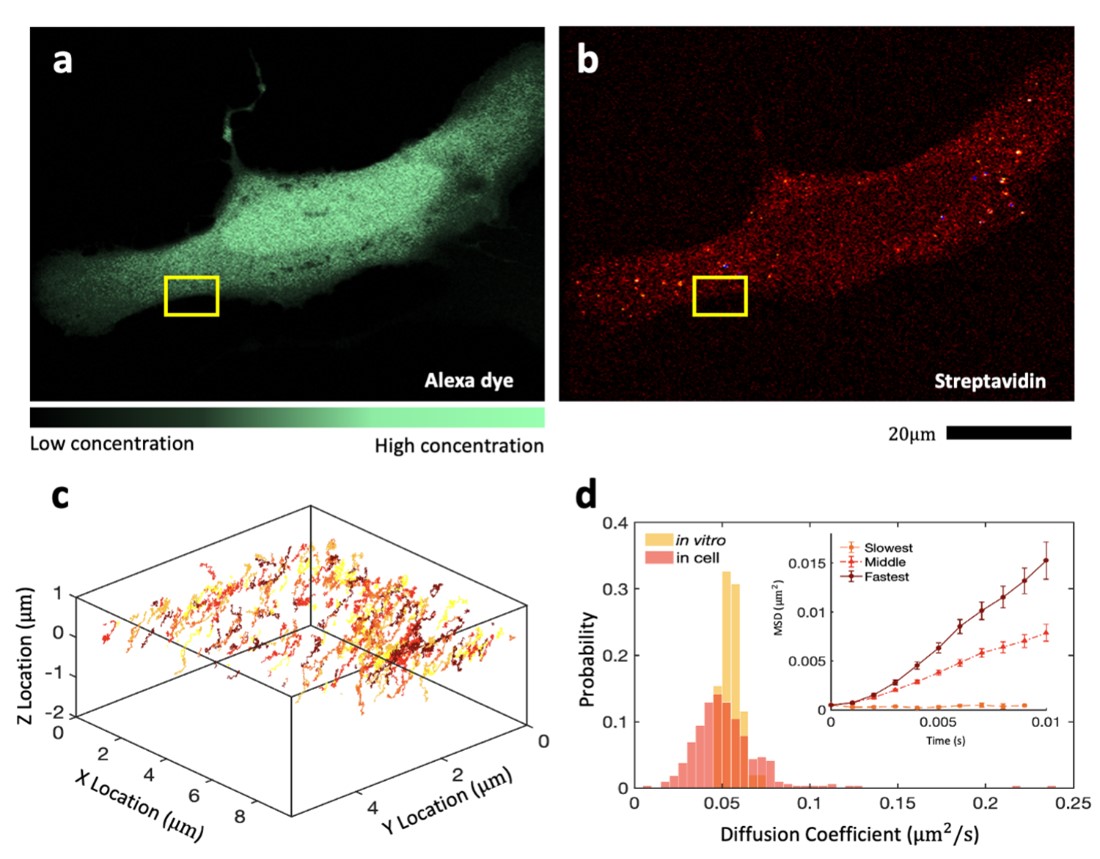
Yuhan and Gopika from the Gruebele lab imaged a U2-OS cell and collected streptavidin tracks. The cell was labeled with Alexa 488 to locate the cells (a) and the streptavidin was labeled with CF633 (b) tracks from the yellow tracking box and can be plotted in X,Y, and Z (c) as-well-as diffusion rates (d).
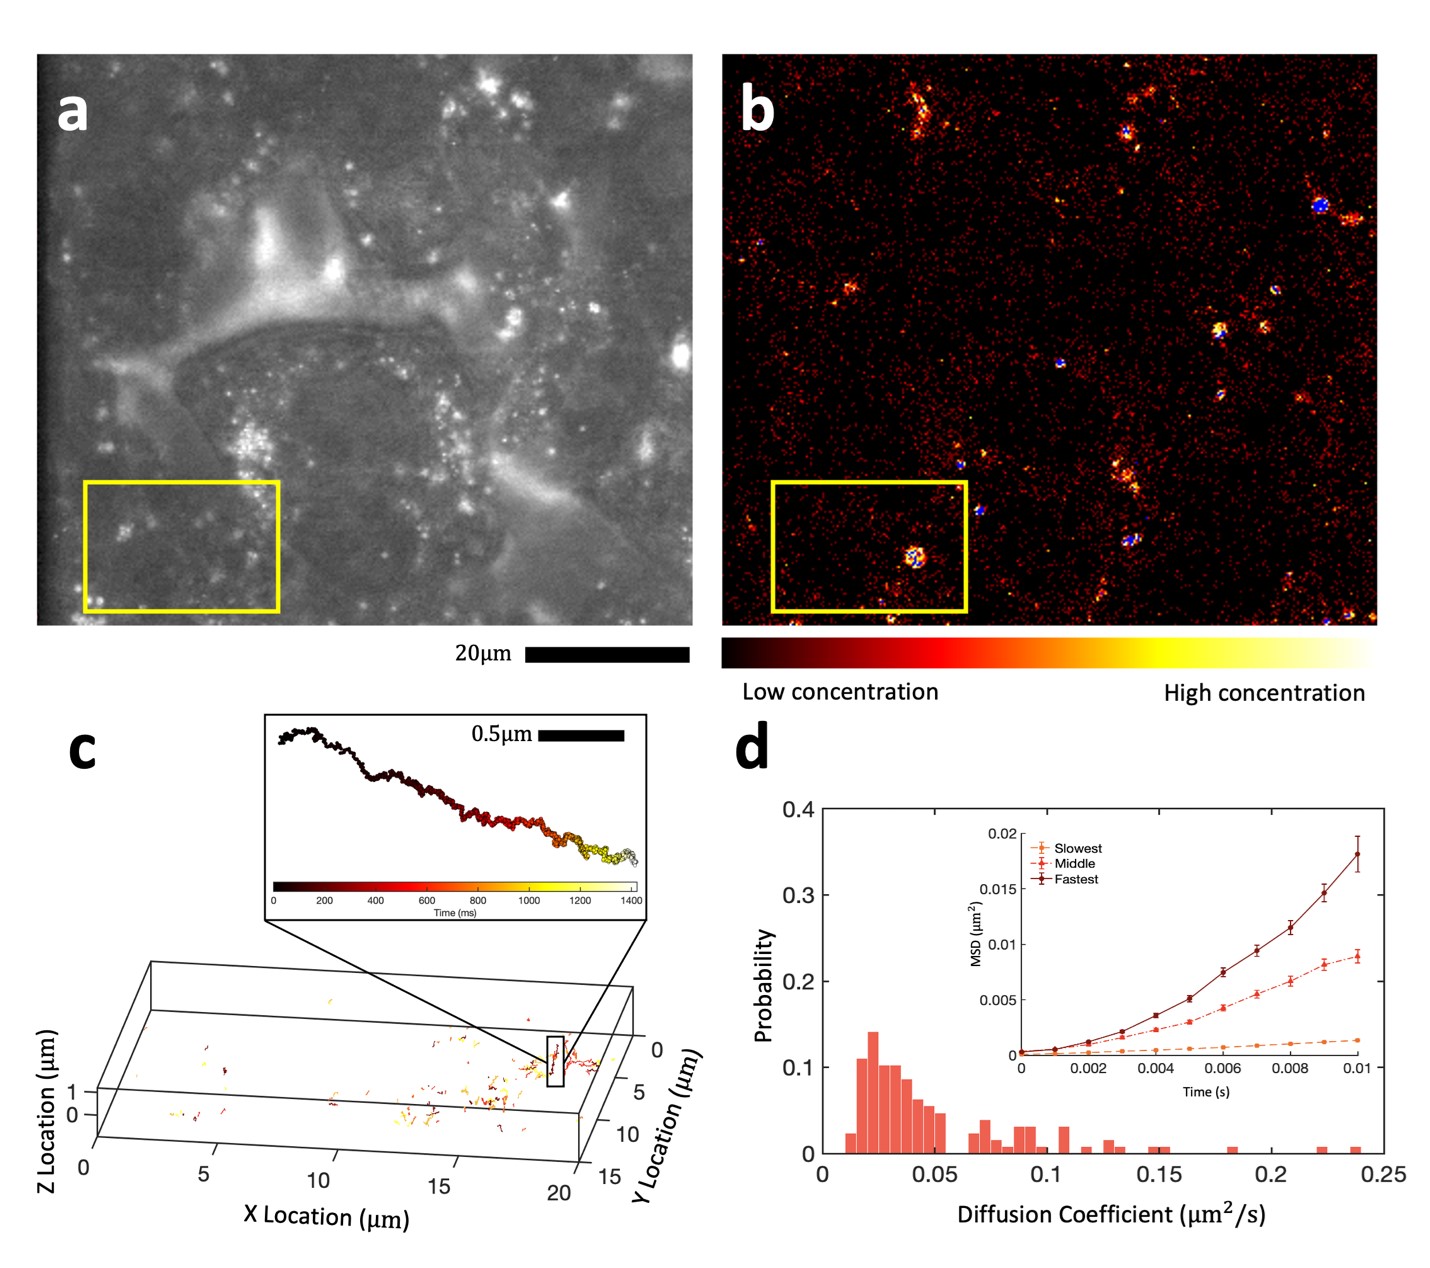
Hepatitis B virus (HBV) was also tracked by Gopika and Yuhan in HepG2 human liver cells. The cell shape is seen in the bright field (a), HBV capsids labeled with mCherry can be seen over the same area (b), tracks from the yellow area are plotted in (c) and diffusion rates in (d).
Kim Lab
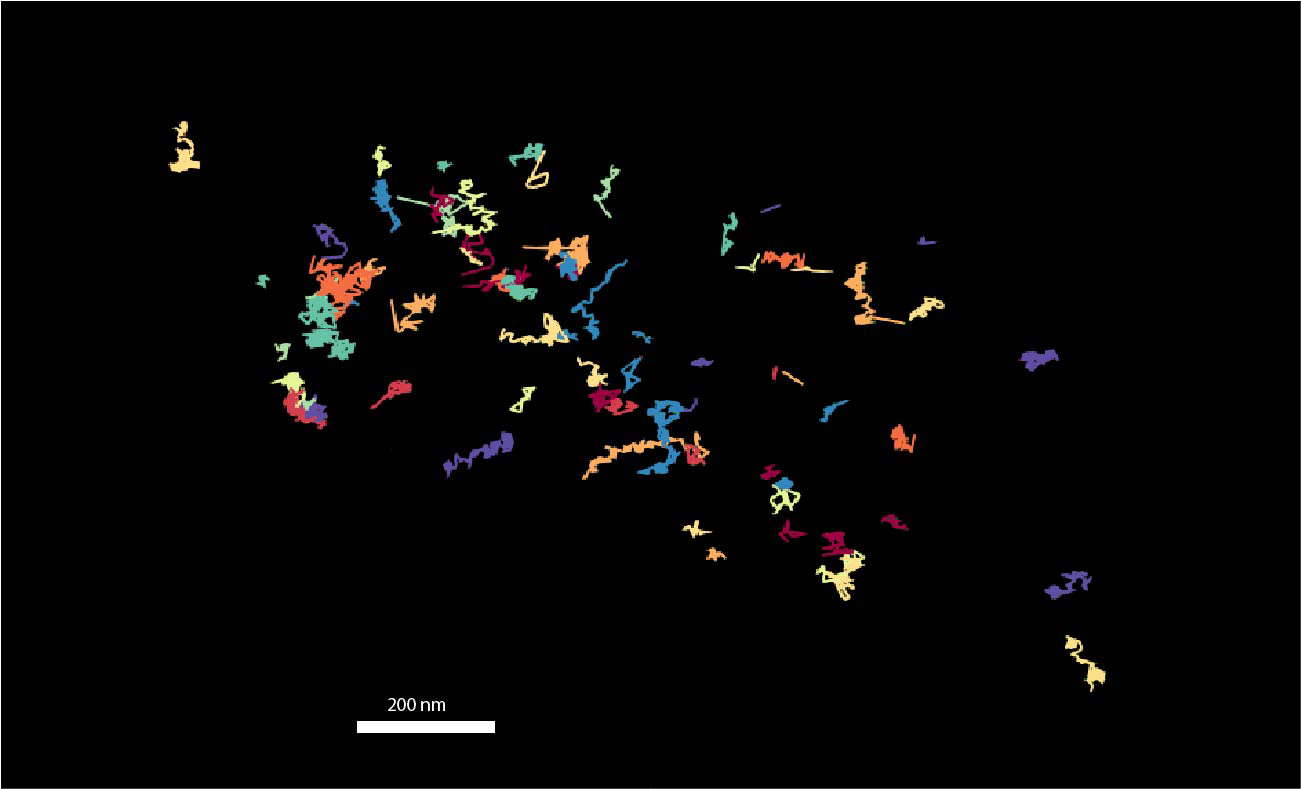
Laura Troyer from the Kim Lab tracked moving RNase E in E.coli.
Qiao Lab
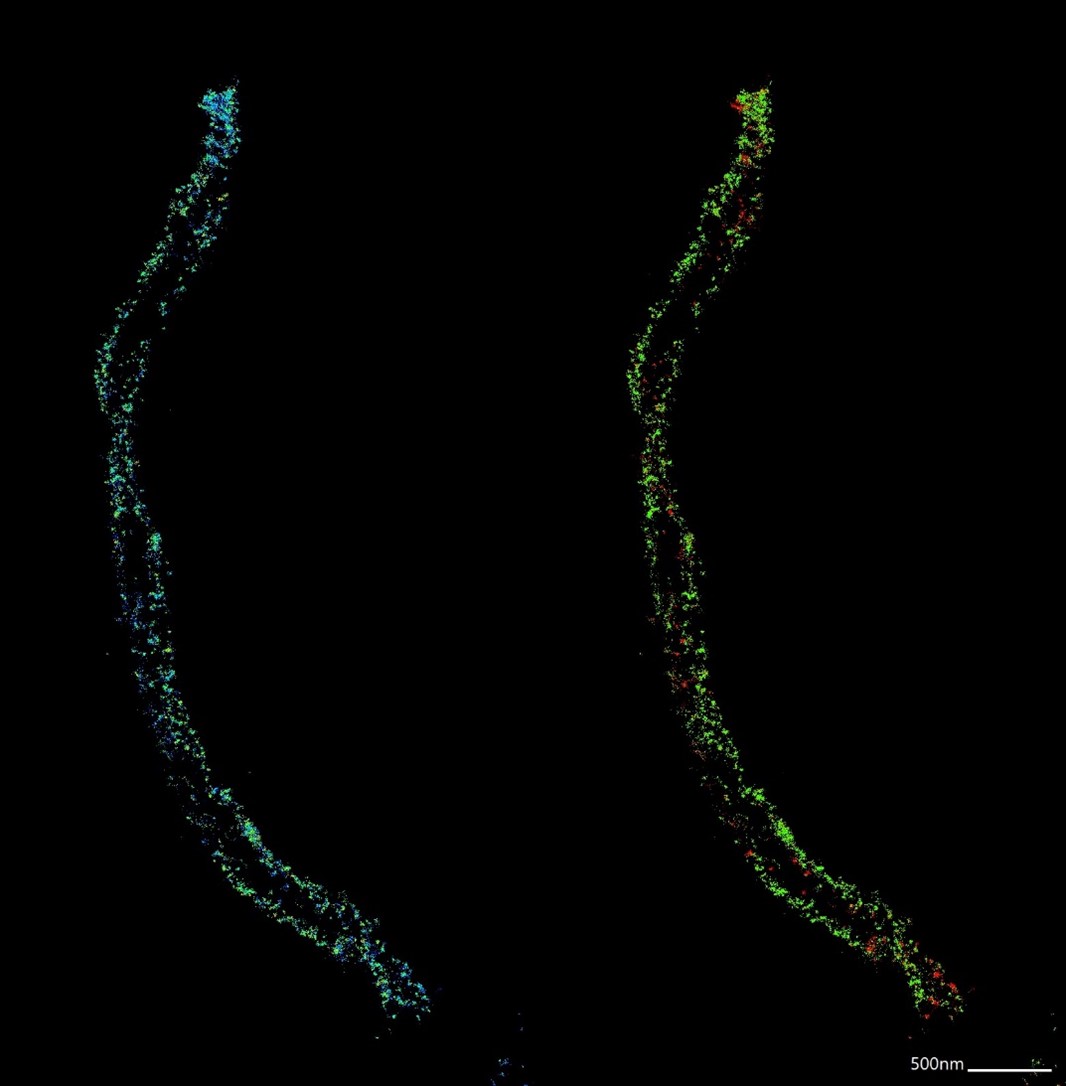
Reza Rajabi-Toustani from the Qiao Lab imaged the synaptonemal comples labeling Sycp3 with Flux640 and Sycp1 with Flux680. The image on the right depicts Sycp3 in green and Sycp1 in red.
Selvin Lab
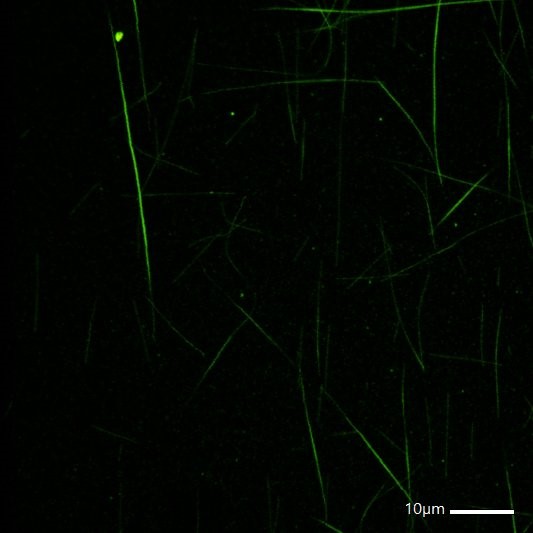
Devinda Wijewardena and Barun Kumar Maity are tracking kinesins labeled with LD655 walking on microtubules labeled with TMR (tetramethylrhodamine) seen in the following figure: