Image showing Polymorphic Crystals of Human Kidney Stone featured in the New York Times published in a Scientific Reports manuscript. https://www.nature.com/articles/s41598-018-31890-9
October 2018

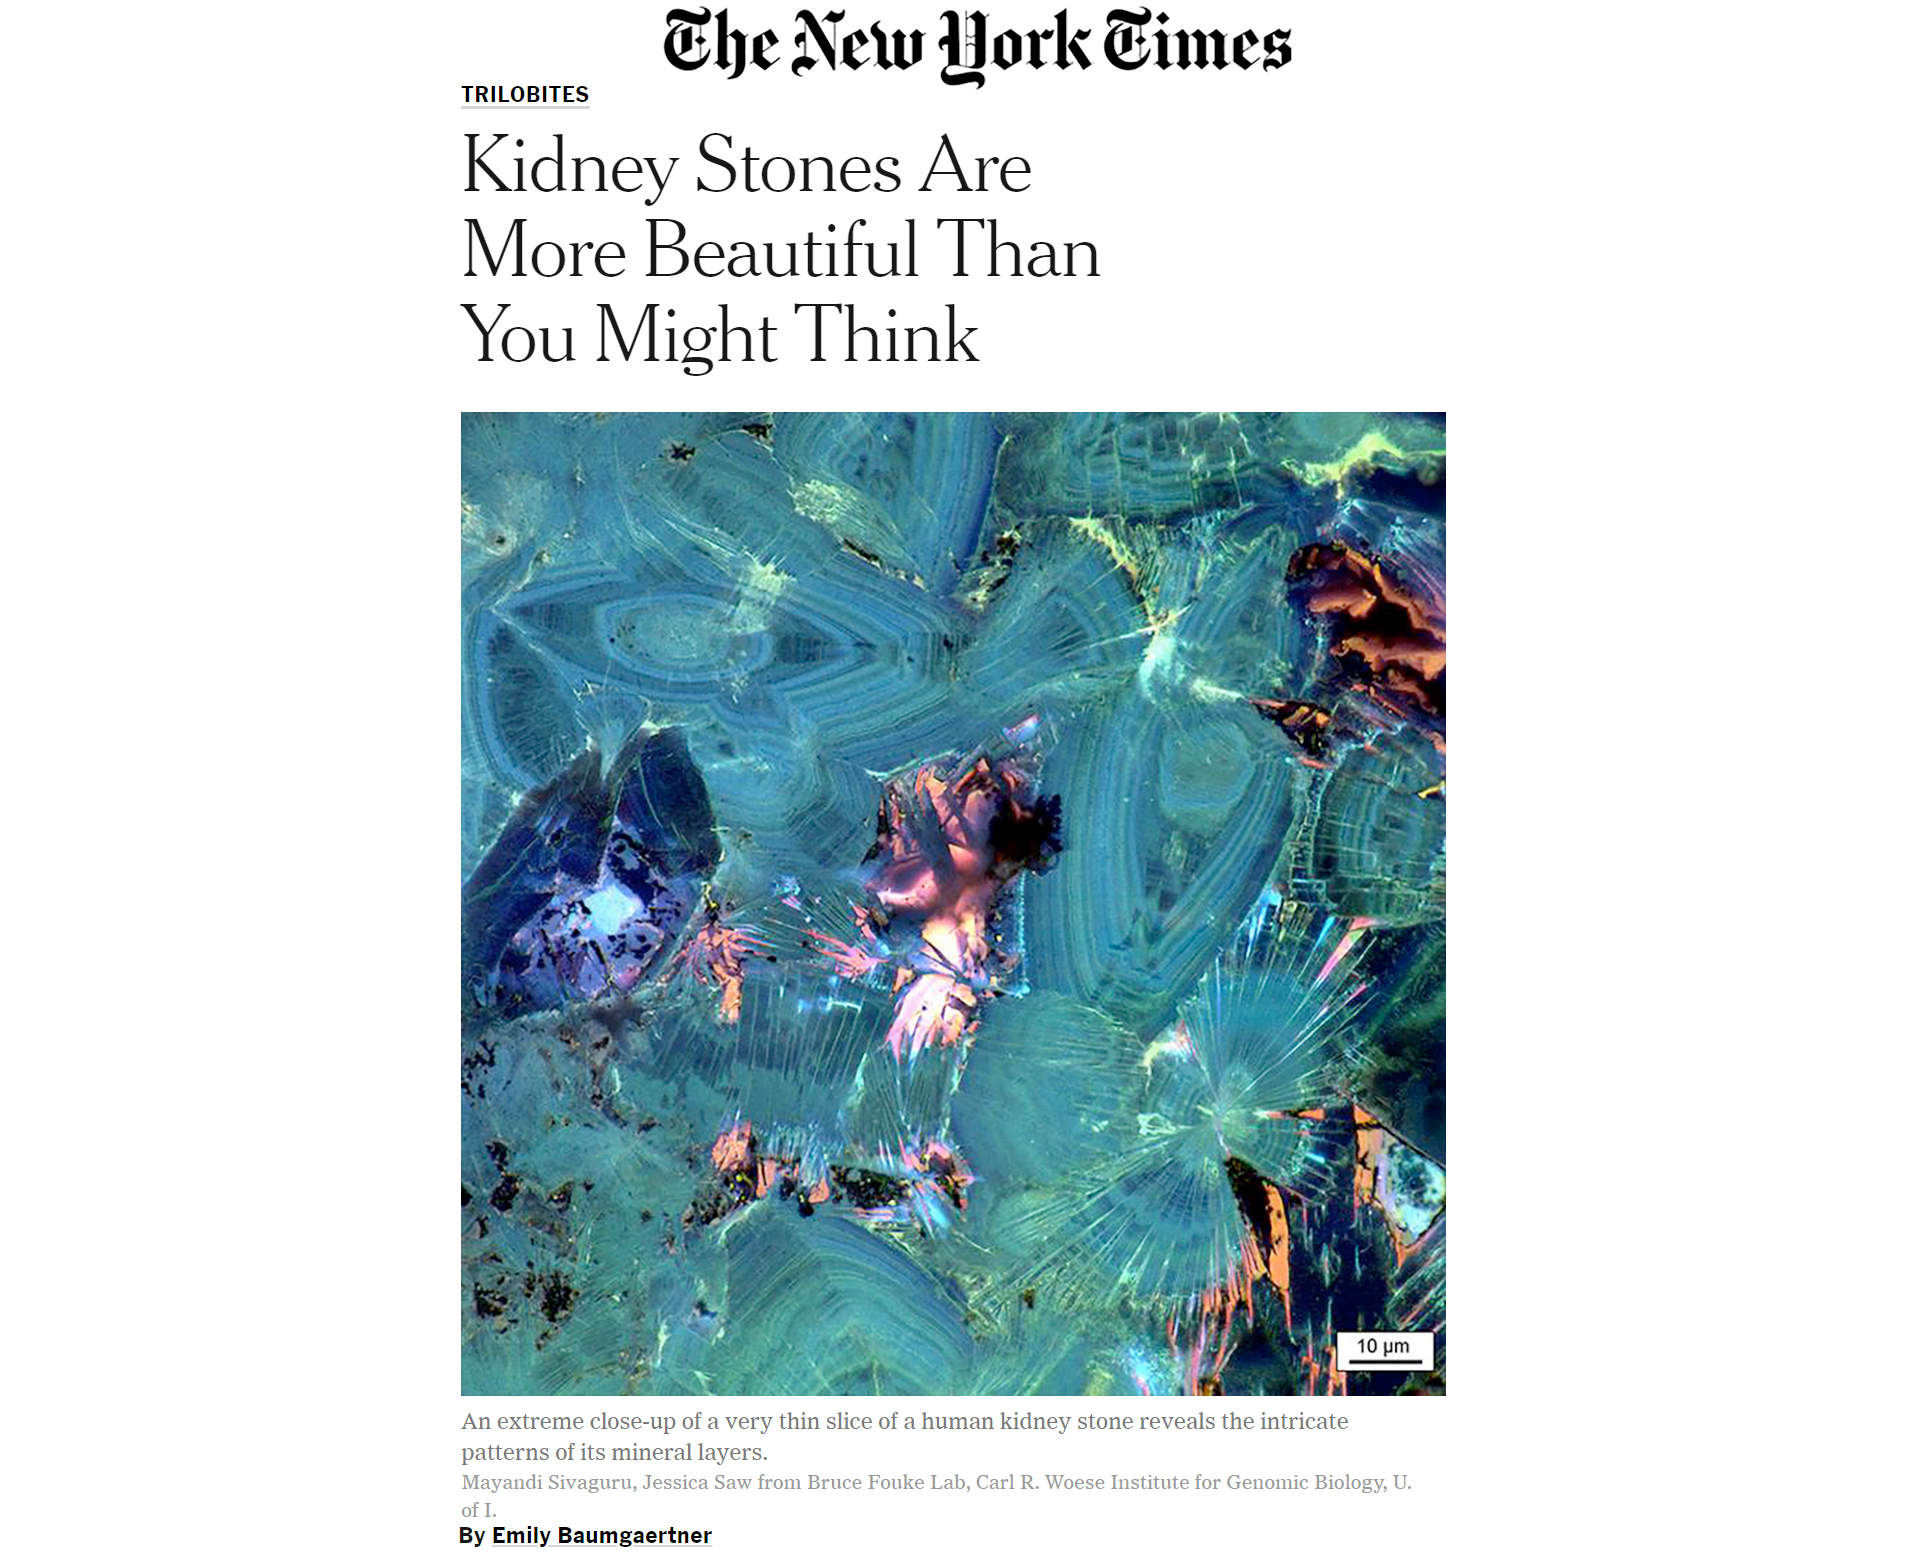
Image showing Polymorphic Crystals of Human Kidney Stone featured in the New York Times published in a Scientific Reports manuscript. https://www.nature.com/articles/s41598-018-31890-9